Plotly 简介 Plotly 是一个交互式的数据可视化库,用于创建高质量的图表和可视化。它支持多种编程语言,包括 Python、R、JavaScript等。
Plotly 提供了丰富的图表类型,包括折线图、散点图、柱状图、饼图、热力图、地图等等。这些图表可以通过交互方式进行探索和操作,例如缩放、平移、悬停显示数据信息等。
使用 Plotly,您可以创建漂亮且具有交互性的图表,并将其嵌入到网页、Jupyter Notebook、Dash应用程序等中。它还支持生成静态图像文件,如PNG、JPEG等。
Plotly 提供了一个面向对象的接口,使得用户可以对图表进行高度定制。您可以设置标题、轴标签、图例、颜色、线型等属性,以及添加注释、标记点、网格线等元素,以满足特定的可视化需求。
此外,Plotly 还提供了在线的可视化工具和社区,您可以在 Plotly 的网站上保存和共享您的图表,与他人进行协作和交流。
Plotly 安装 Plotly 使用 导入模块 1 2 3 4 5 6 7 8 9 10 import osimport numpy as npimport pandas as pdimport plotly as pyimport plotly.graph_objects as goimport plotly.express as pxfrom plotly import toolsimport warningswarnings.filterwarnings('ignore' )
plotly.graph_objects 模块绘图 折线图 单数据 源数据:
1 2 t = np.linspace(0 , 10 , 100 ) y = np.sin(t)
绘图:
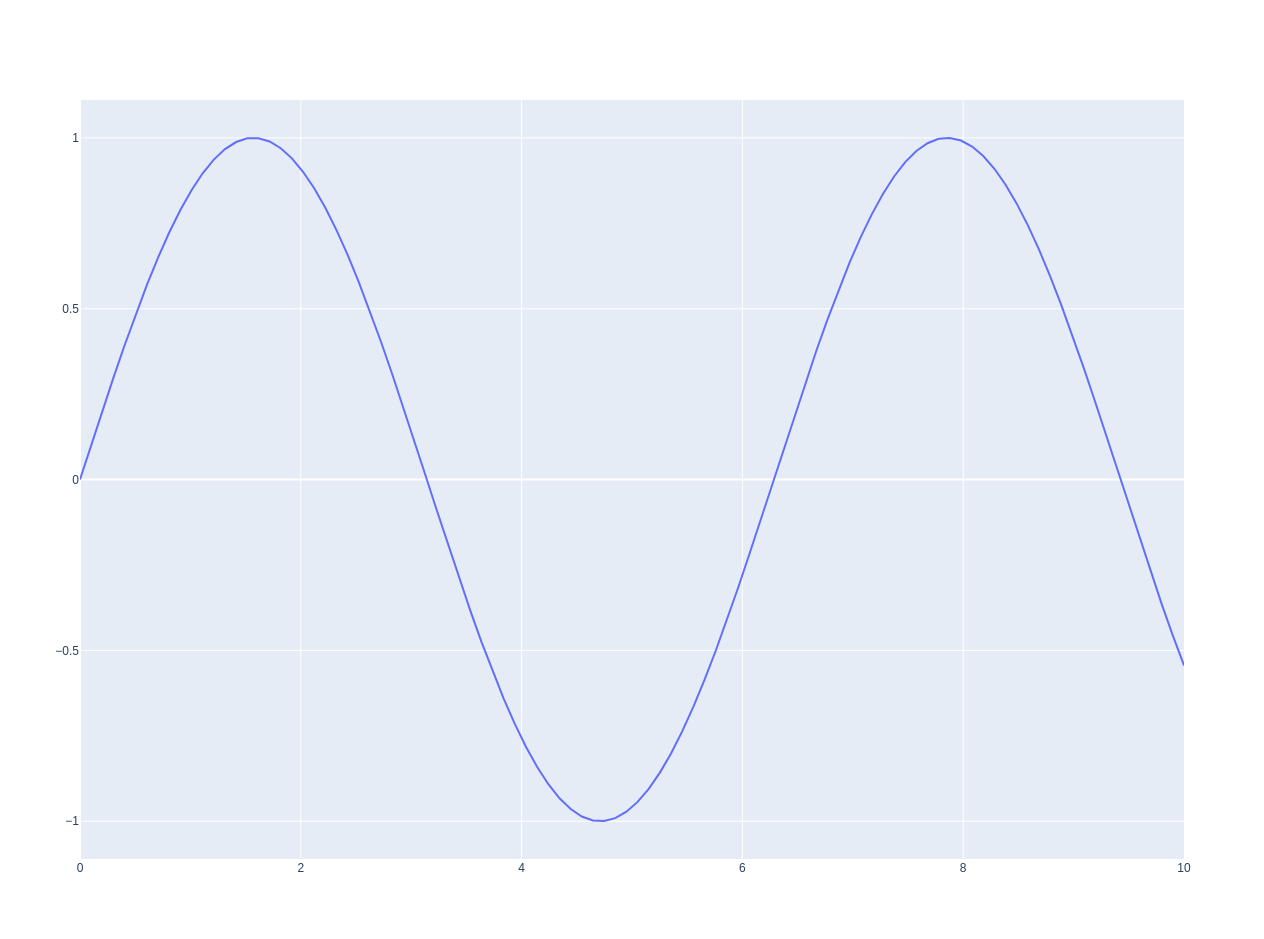
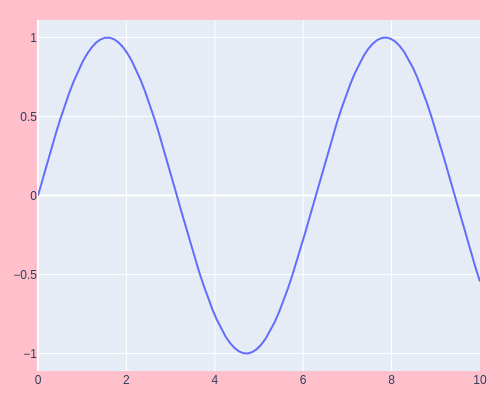
1 2 3 4 5 6 7 8 9 10 11 12 13 14 15 16 data = go.Scatter(x = t, y = y, mode='lines' ) fig = go.Figure(data) fig.update_layout( margin=dict (l=20 , r=20 , t=20 , b=20 ), paper_bgcolor='pink' , width=500 , height=400 ) fig.show()
图如下:
不设置布局属性的原图 :
设置图片属性后的图 :
多数据 源数据:
1 2 3 t = np.linspace(0 , 10 , 100 ) y1 = np.sin(t) y2 = np.cos(t)*2
绘图:
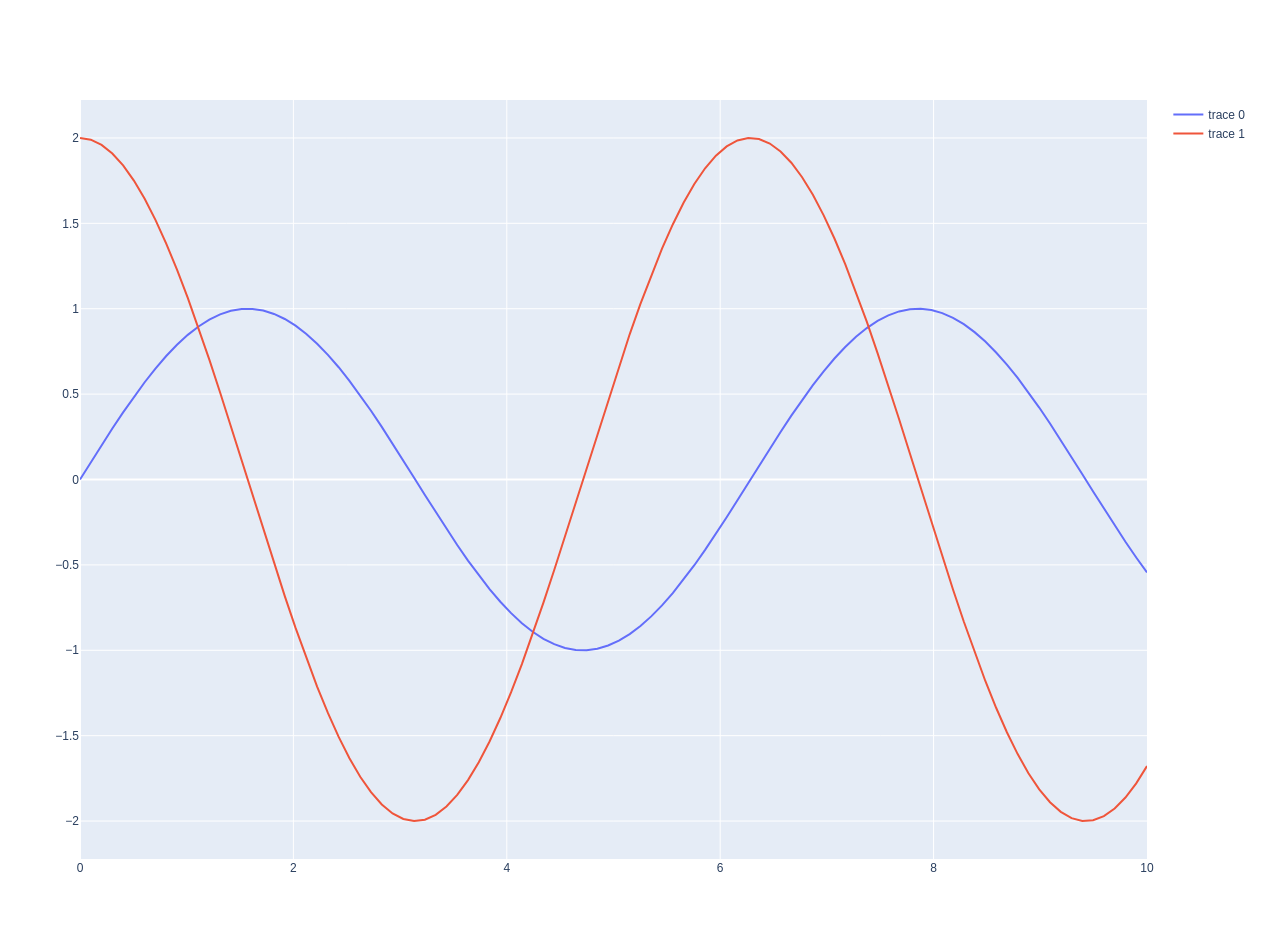
1 2 3 4 5 trace1 = go.Scatter(x =t, y=y1, mode='lines' ) trace2 = go.Scatter(x=t, y=y2, mode='lines' ) fig=go.Figure([trace1, trace2]) fig.show()
图如下:
柱状图 单数据 源数据:
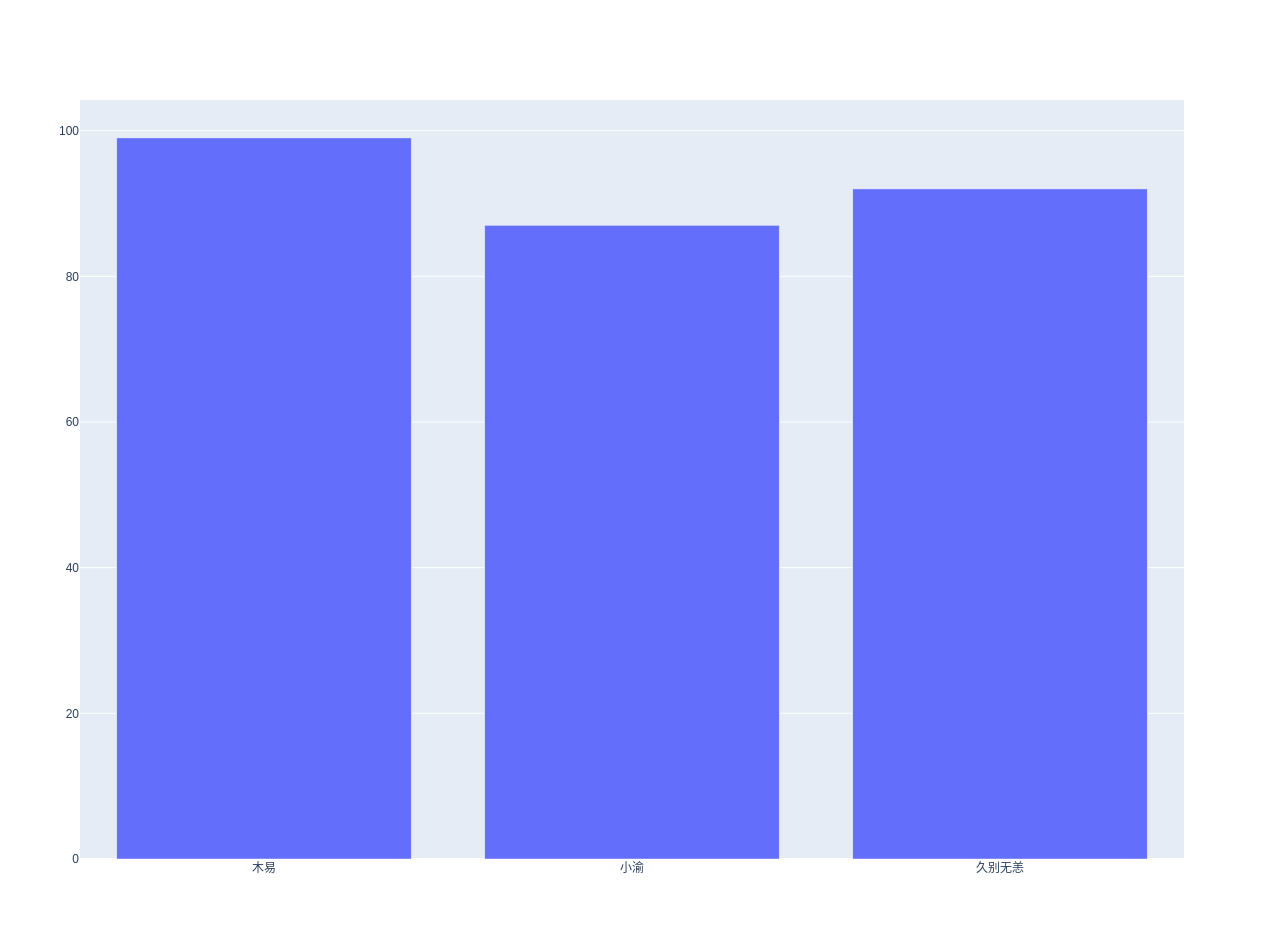
1 2 friends = ['木易' ,'小渝' , '久别无恙' ] data = go.Bar(x=friends, y =[99 , 87 , 92 ])
绘图:
1 2 fig = go.Figure(data) fig.show()
图如下:
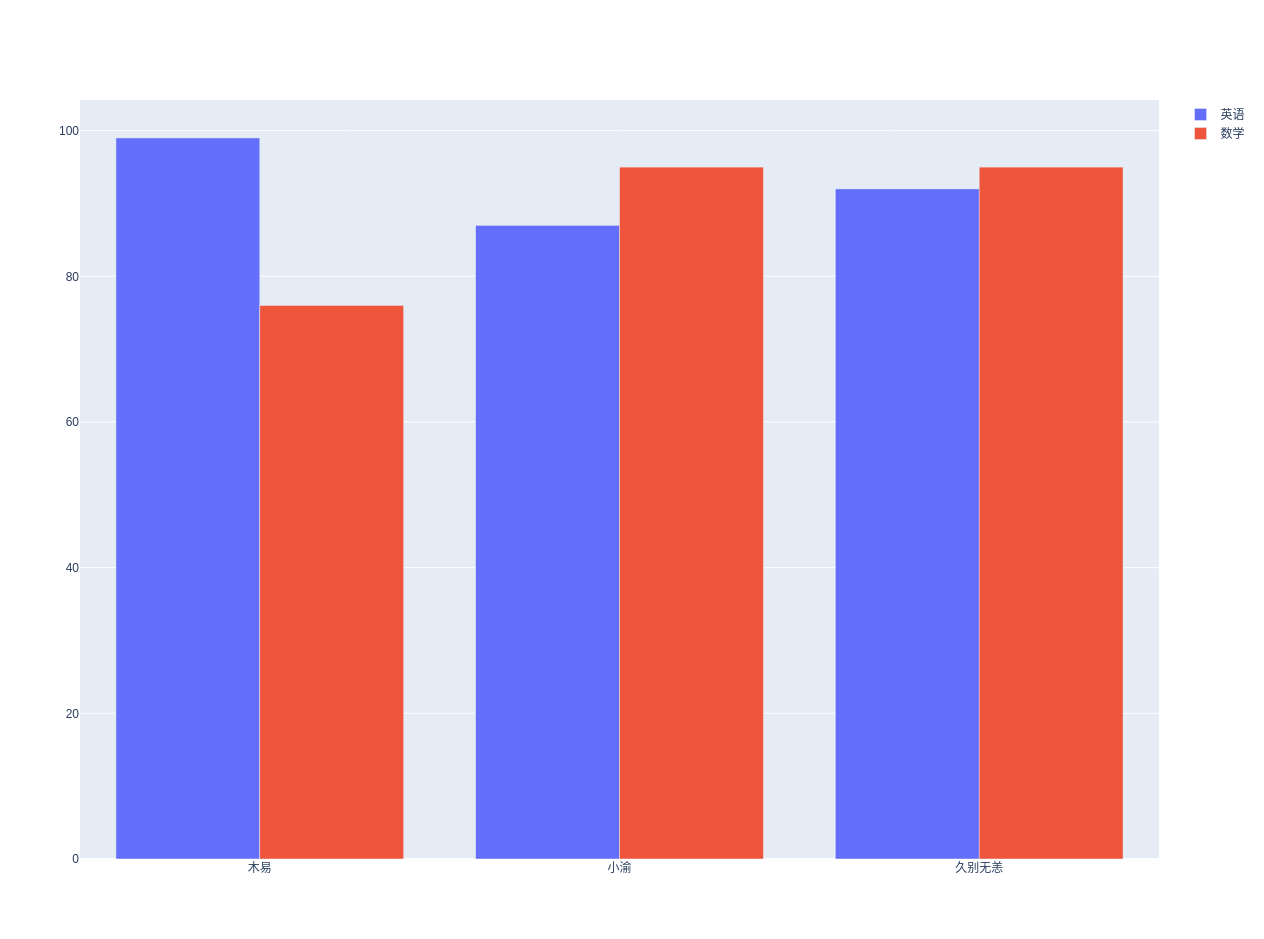
多数据(并排) 源数据:
1 2 3 friends = ['木易' ,'小渝' , '久别无恙' ] data1 = go.Bar(x=friends, y =[99 , 87 , 92 ], name='英语' ) data2 = go.Bar(x=friends, y =[76 , 95 , 95 ], name='数学' )
绘图:
1 2 fig = go.Figure([data1, data2]) fig.show()
图如下:
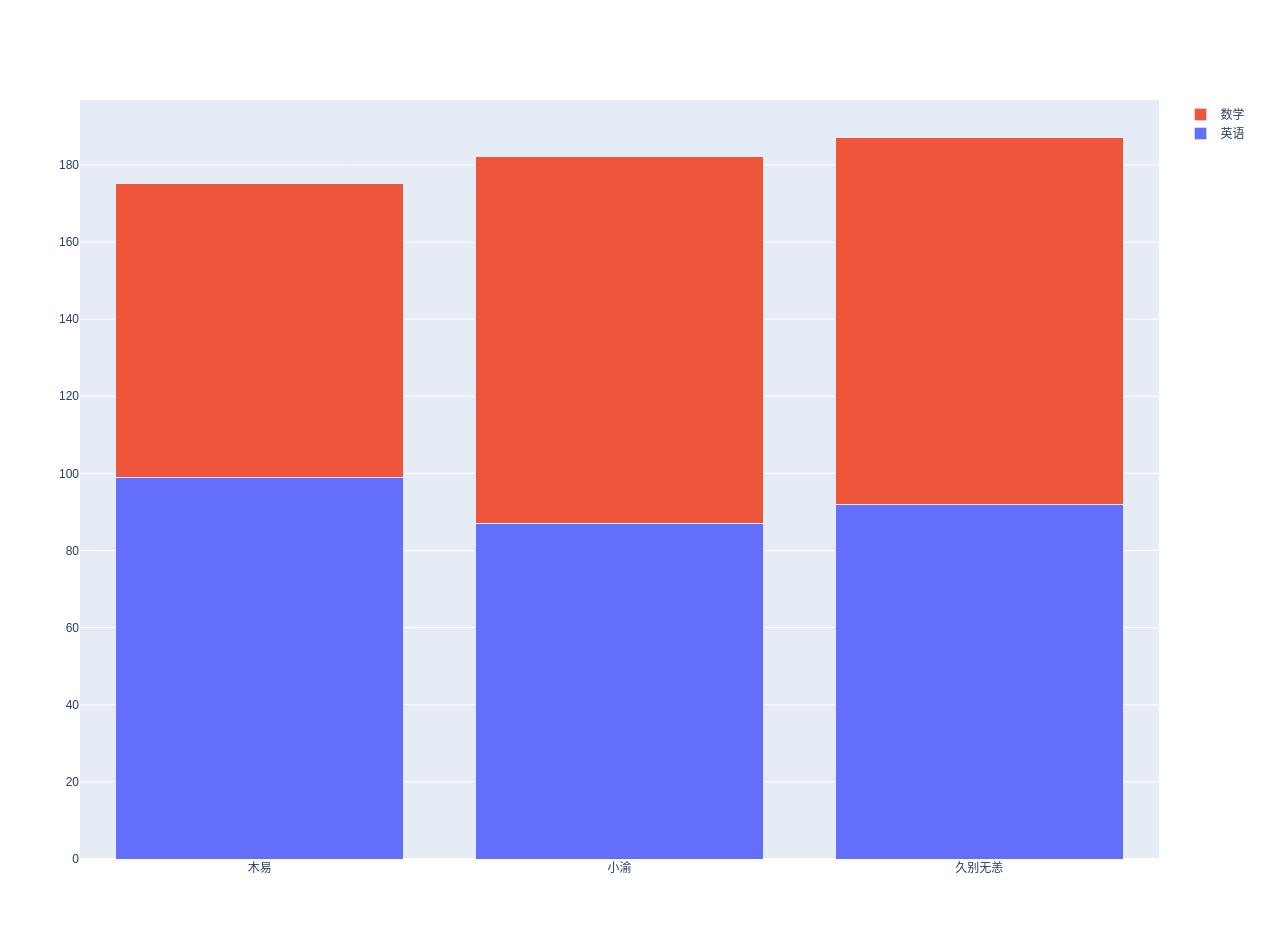
多数据(叠加) 常用于数据组之间的 百分比 比较
源数据:
1 2 3 friends = ['木易' ,'小渝' , '久别无恙' ] data1 = go.Bar(x=friends, y =[99 , 87 , 92 ], name='英语' ) data2 = go.Bar(x=friends, y =[76 , 95 , 95 ], name='数学' )
绘图:
1 2 3 4 5 fig = go.Figure([data1, data2]) fig.update_layout(barmode='stack' ) fig.show()
图如下:
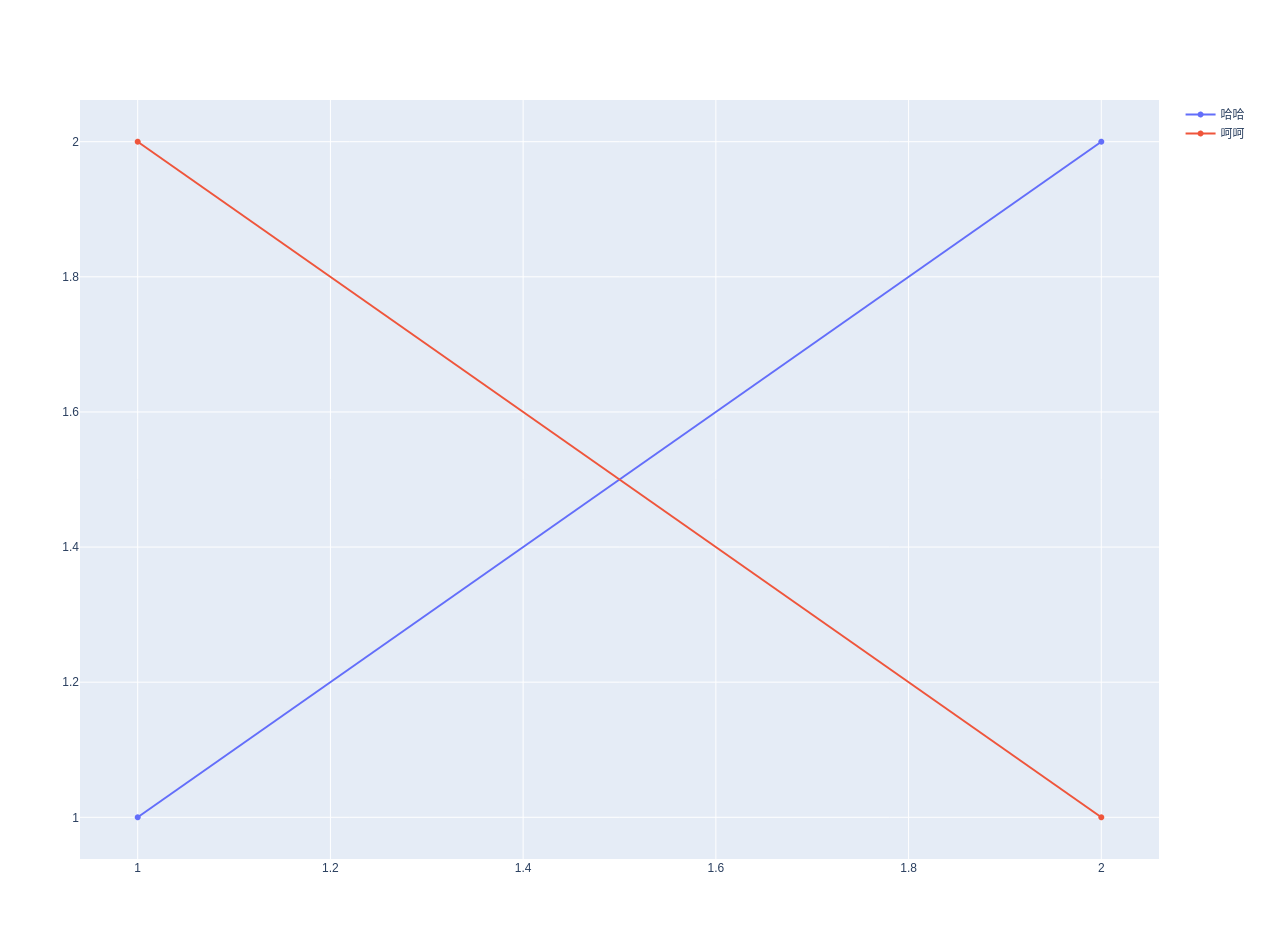
点线组合 源数据:
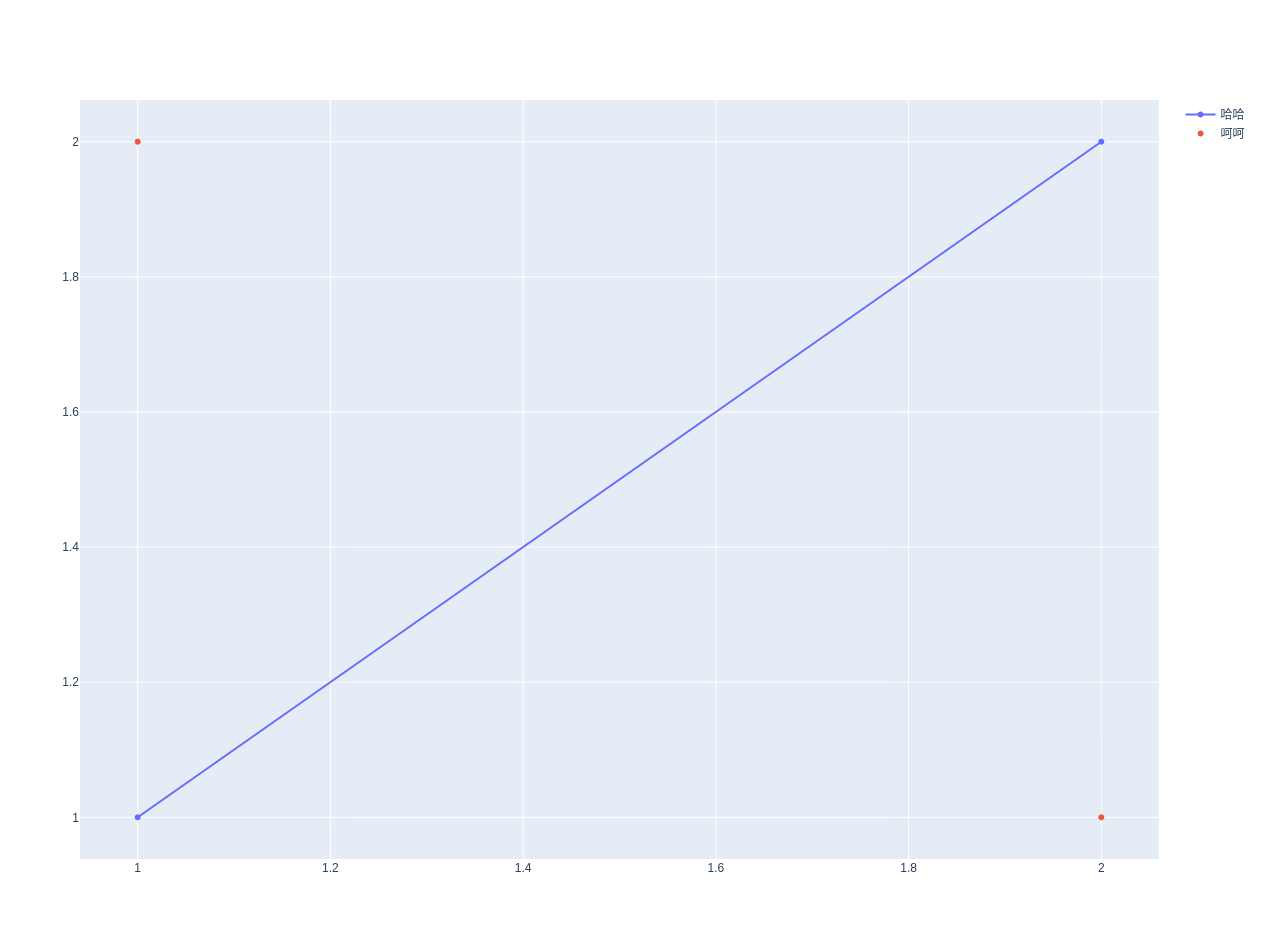
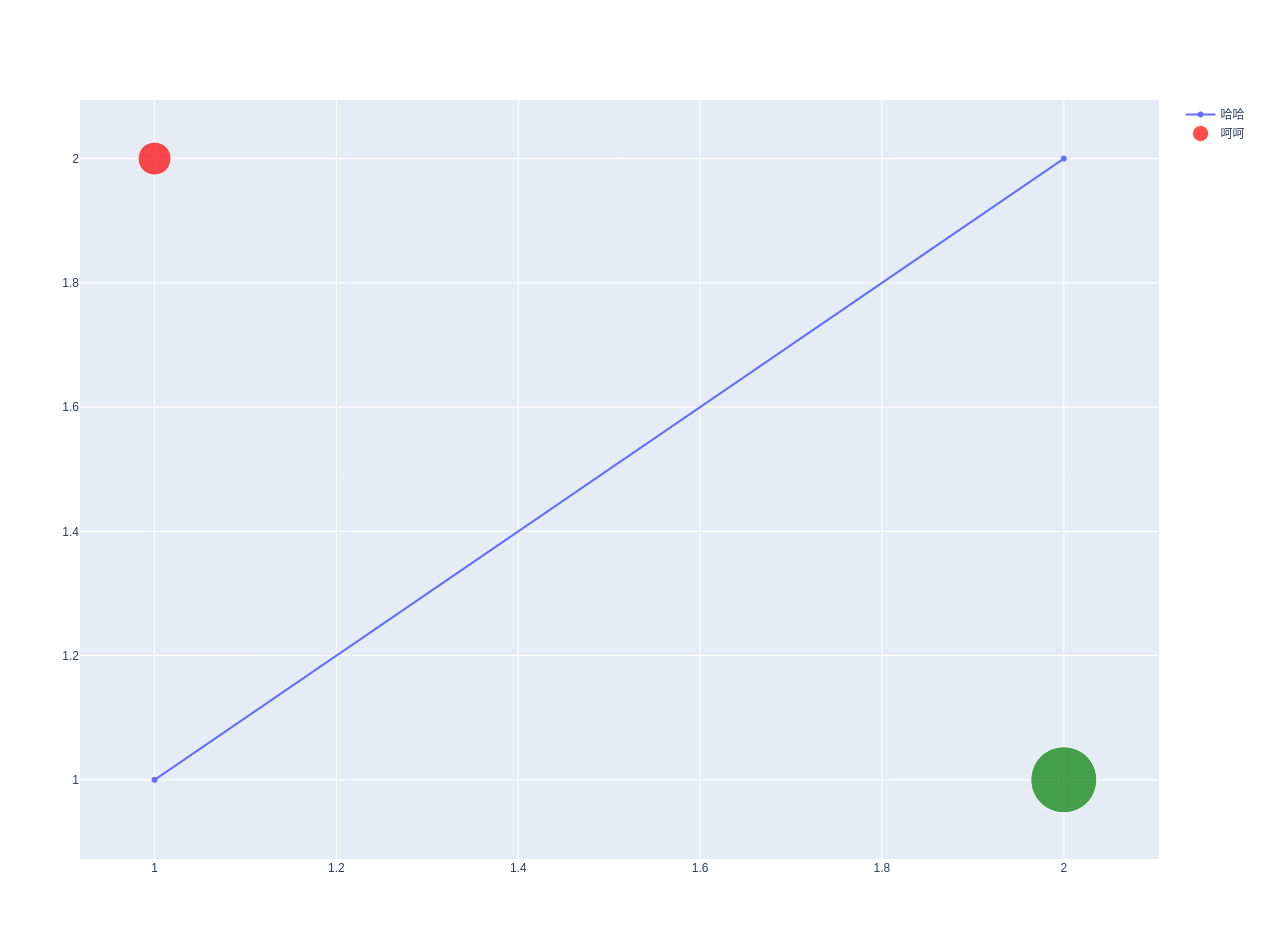
1 2 3 4 5 6 7 8 9 10 11 12 13 14 15 16 trace1 = go.Scatter( x = [1 , 2 ], y = [1 , 2 ], name='哈哈' ) trace2= go.Scatter( x = [1 , 2 ], y = [2 , 1 ], name='呵呵' , marker=dict ( color = ['red' ,'green' ], size = [33 , 66 ] ), mode='markers' )
绘图:
1 2 fig= go.Figure([trace1, trace2]) fig.show()
不设置任何属性的原图 :
设置 mode=’markers’ 属性的图 :
设置 marker=dict(color = [‘red’,’green’],size = [33, 66]) 属性的图 :
lotly.expression 模块绘图 散点图 源数据:
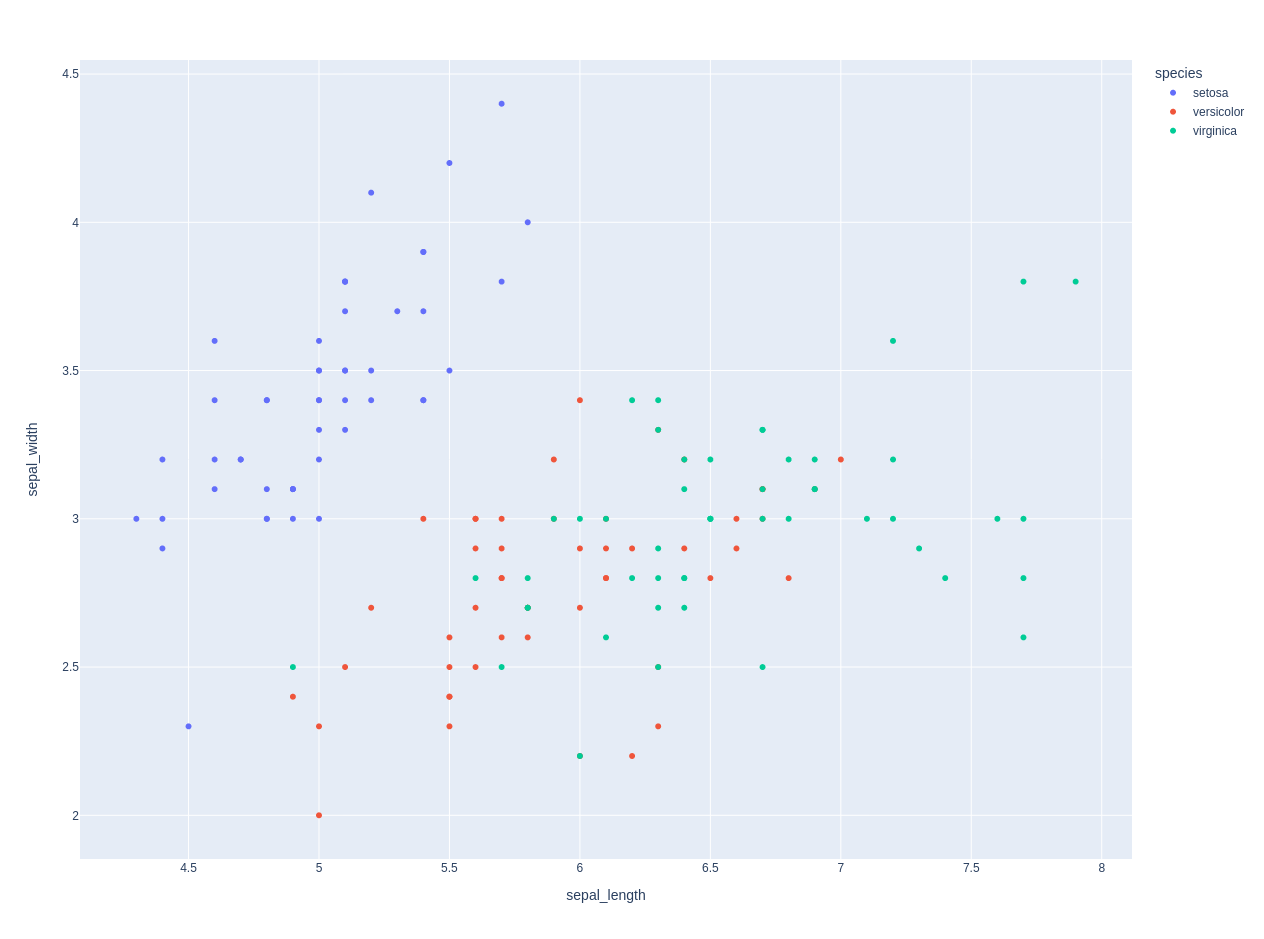
1 2 3 4 5 6 7 8 9 10 iris = px.data.iris() print (iris.head())''' sepal_length sepal_width petal_length petal_width species species_id 0 5.1 3.5 1.4 0.2 setosa 1 1 4.9 3.0 1.4 0.2 setosa 1 2 4.7 3.2 1.3 0.2 setosa 1 3 4.6 3.1 1.5 0.2 setosa 1 4 5.0 3.6 1.4 0.2 setosa 1 '''
绘图:
1 2 fig = px.scatter(iris, x='sepal_length' , y='sepal_width' , color='species' ) fig.show()
图如下:
饼图 源数据:
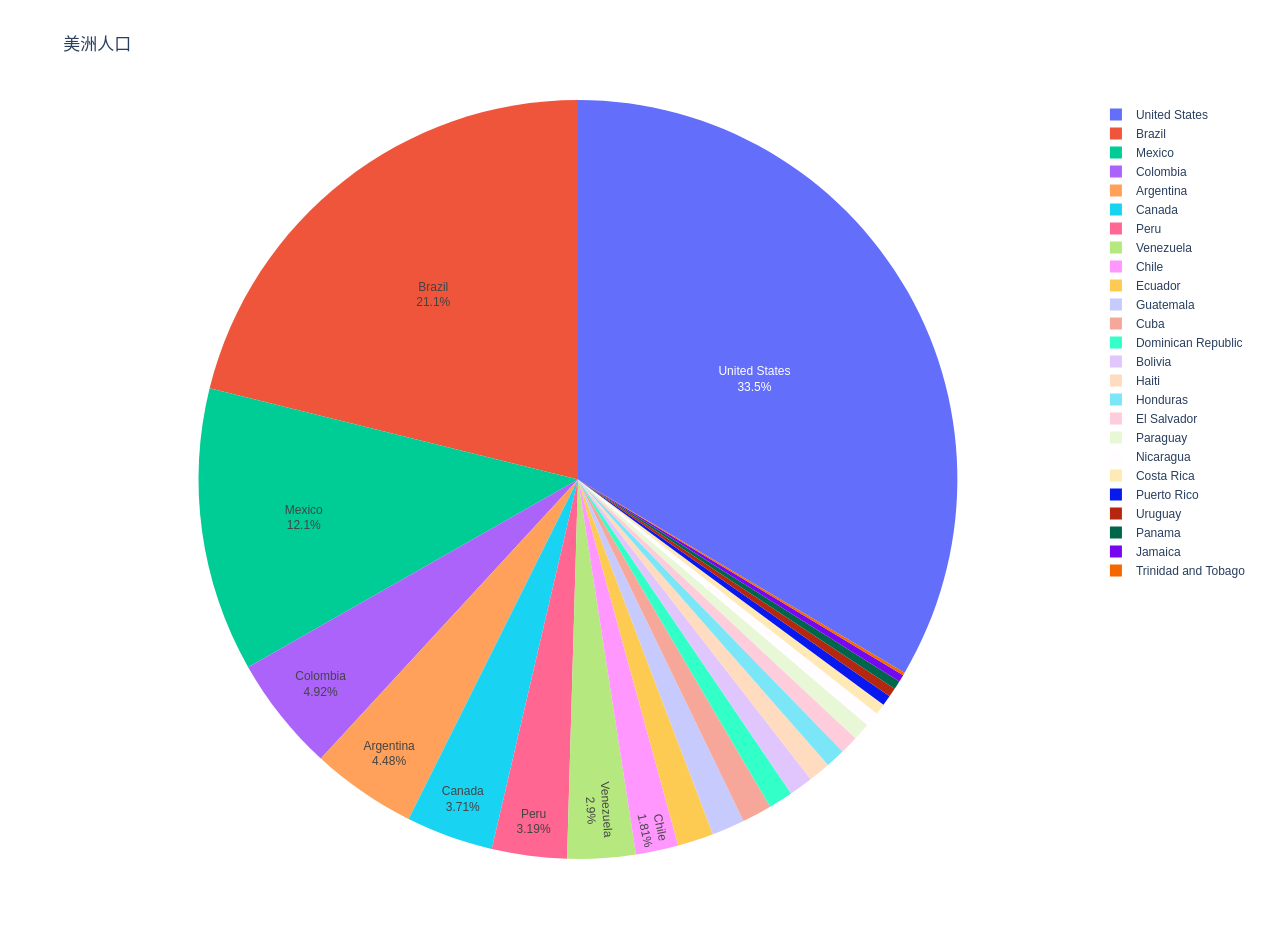
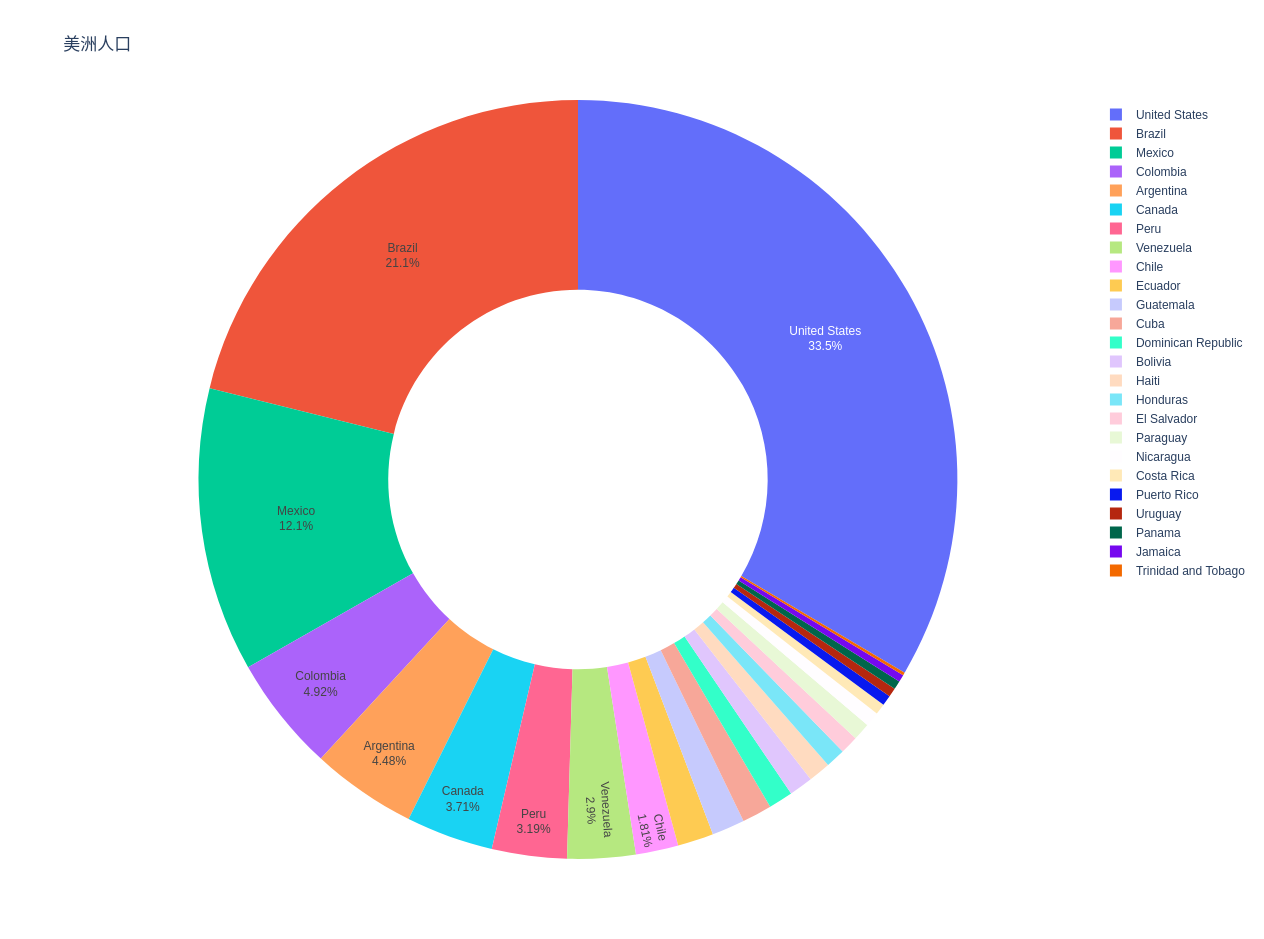
1 2 3 4 5 6 7 8 9 10 11 12 13 14 15 16 17 18 19 20 21 22 23 24 25 26 27 28 29 30 31 32 df = px.data.gapminder().query("year==2007" ).query('continent =="Americas"' ) print (df)''' country continent year ... gdpPercap iso_alpha iso_num 59 Argentina Americas 2007 ... 12779.379640 ARG 32 143 Bolivia Americas 2007 ... 3822.137084 BOL 68 179 Brazil Americas 2007 ... 9065.800825 BRA 76 251 Canada Americas 2007 ... 36319.235010 CAN 124 287 Chile Americas 2007 ... 13171.638850 CHL 152 311 Colombia Americas 2007 ... 7006.580419 COL 170 359 Costa Rica Americas 2007 ... 9645.061420 CRI 188 395 Cuba Americas 2007 ... 8948.102923 CUB 192 443 Dominican Republic Americas 2007 ... 6025.374752 DOM 214 455 Ecuador Americas 2007 ... 6873.262326 ECU 218 479 El Salvador Americas 2007 ... 5728.353514 SLV 222 611 Guatemala Americas 2007 ... 5186.050003 GTM 320 647 Haiti Americas 2007 ... 1201.637154 HTI 332 659 Honduras Americas 2007 ... 3548.330846 HND 340 791 Jamaica Americas 2007 ... 7320.880262 JAM 388 995 Mexico Americas 2007 ... 11977.574960 MEX 484 1115 Nicaragua Americas 2007 ... 2749.320965 NIC 558 1187 Panama Americas 2007 ... 9809.185636 PAN 591 1199 Paraguay Americas 2007 ... 4172.838464 PRY 600 1211 Peru Americas 2007 ... 7408.905561 PER 604 1259 Puerto Rico Americas 2007 ... 19328.709010 PRI 630 1559 Trinidad and Tobago Americas 2007 ... 18008.509240 TTO 780 1619 United States Americas 2007 ... 42951.653090 USA 840 1631 Uruguay Americas 2007 ... 10611.462990 URY 858 1643 Venezuela Americas 2007 ... 11415.805690 VEN 862 [25 rows x 8 columns] '''
绘图:
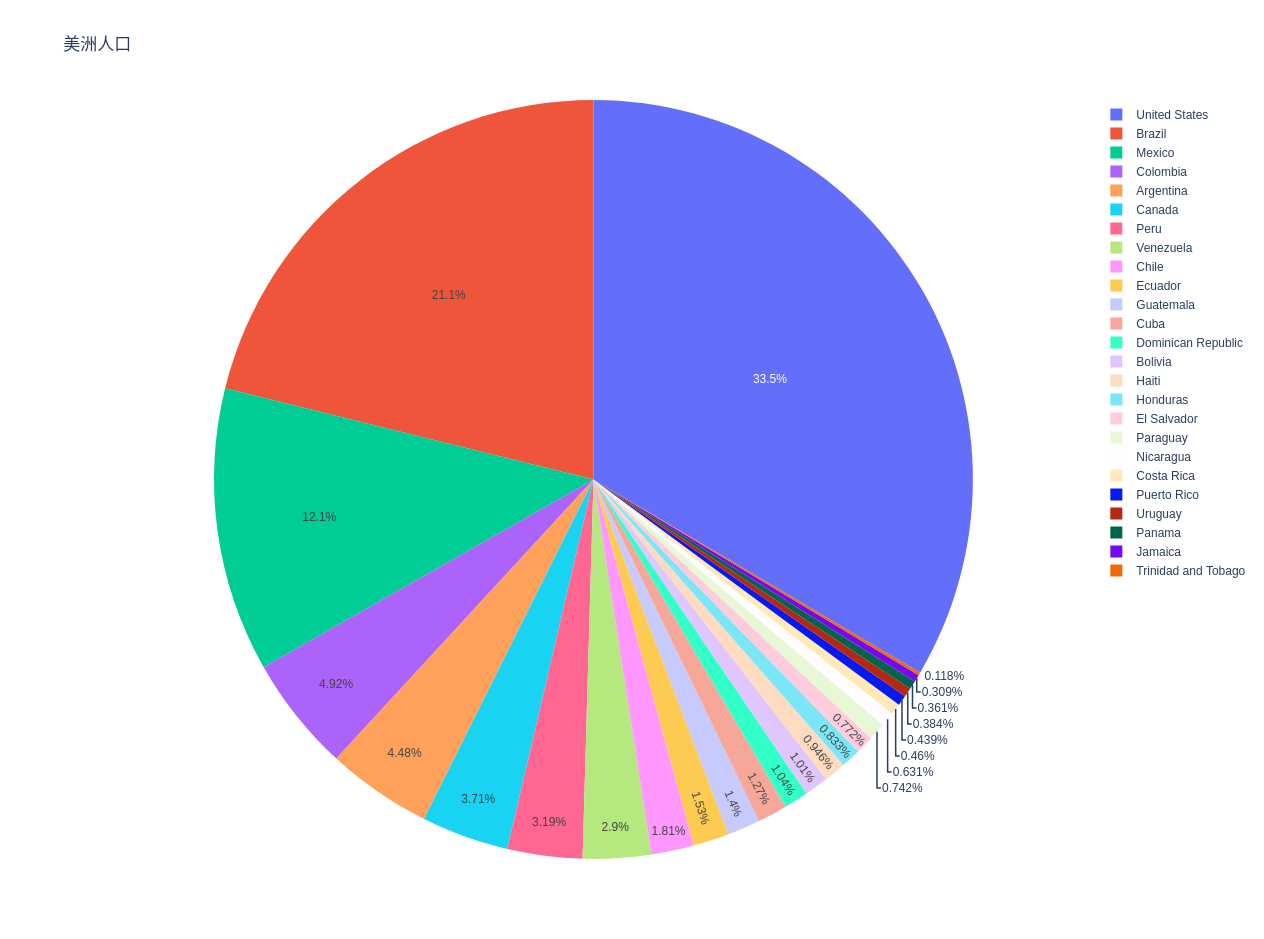
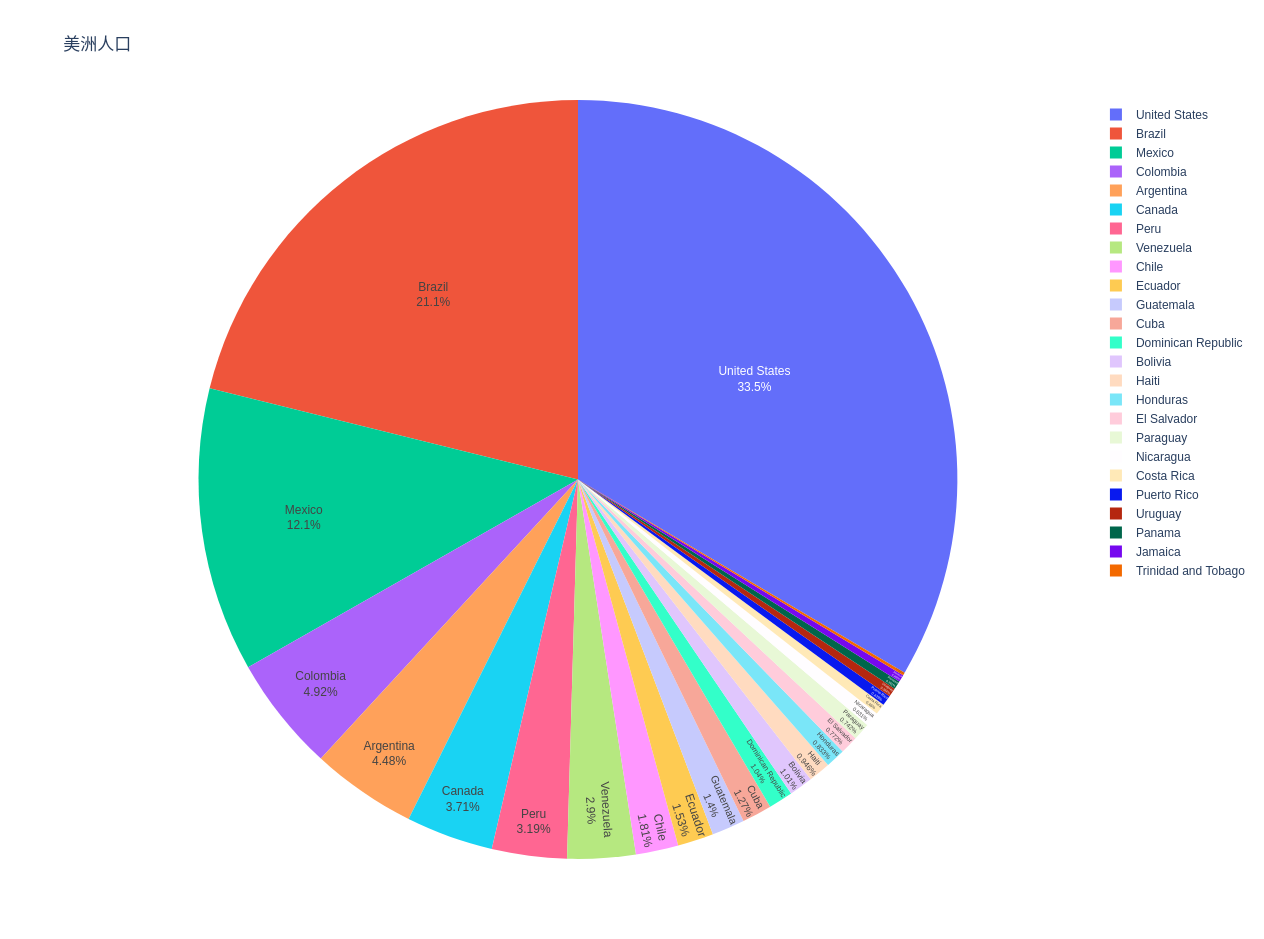
1 2 3 4 fig= px.pie(df, values = 'pop' , names = 'country' , title="美洲人口" , hover_data=['lifeExp' ],hole=0.5 ) fig.update_traces(textposition="inside" , textinfo="percent+label" ) fig.update_layout(uniformtext_minsize=12 , uniformtext_mode='hide' ) fig.show()
图如下:
不设置任何属性的原图 :
设置 fig.update_traces(textposition=”inside”, textinfo=”percent+label”) 属性的图 :
设置 fig.update_layout(uniformtext_minsize=12, uniformtext_mode=’hide’) 属性的图 :
设置 hole=0.5 属性的图 :
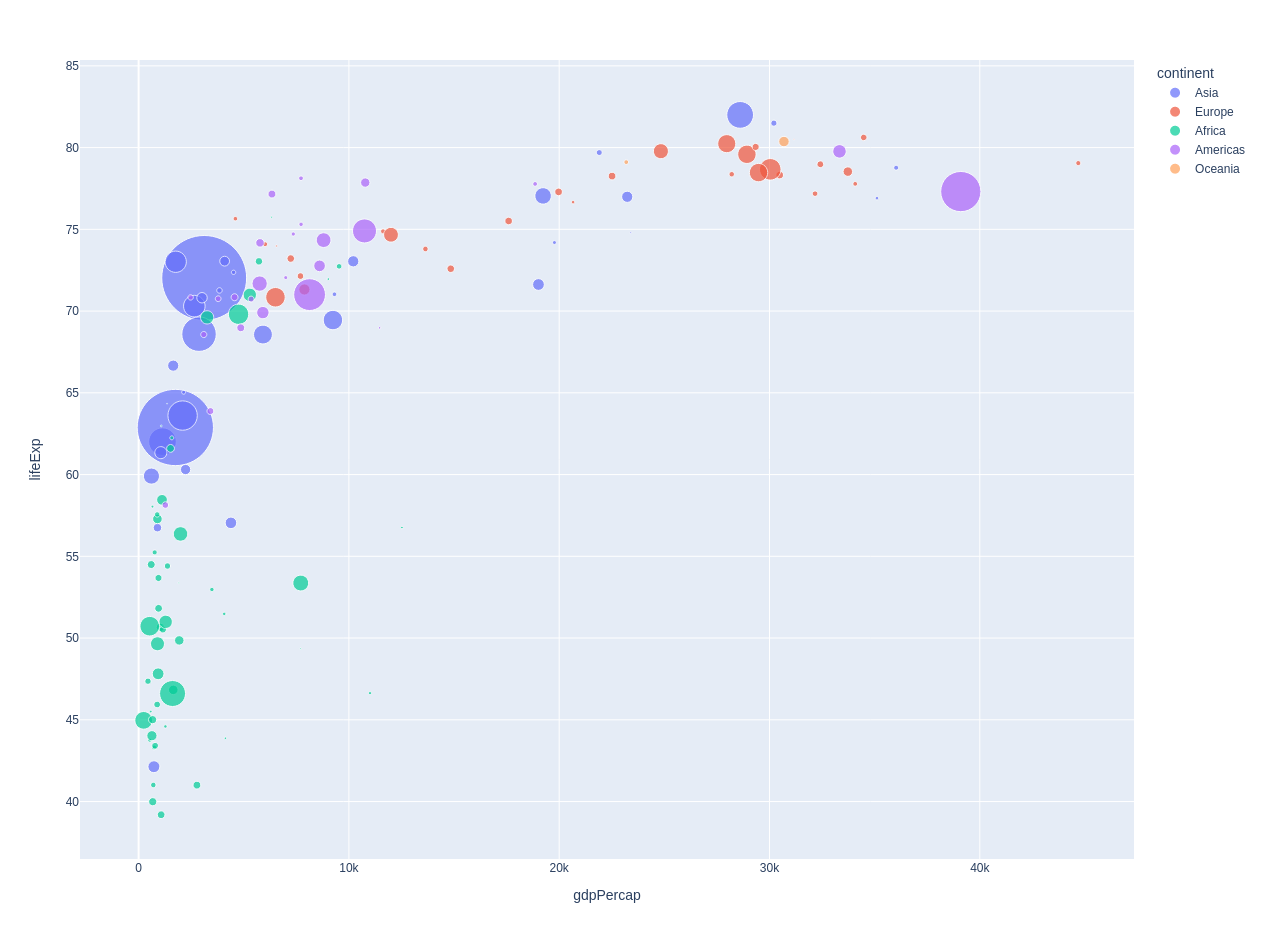
气泡图 源数据:
1 gap = px.data.gapminder().query("year == 2002" )
绘图:
1 2 3 4 5 6 7 8 9 fig = px.scatter( gap, x = 'gdpPercap' , y = 'lifeExp' , size = 'pop' , size_max=60 , color='continent' ) fig.show()
图如下:
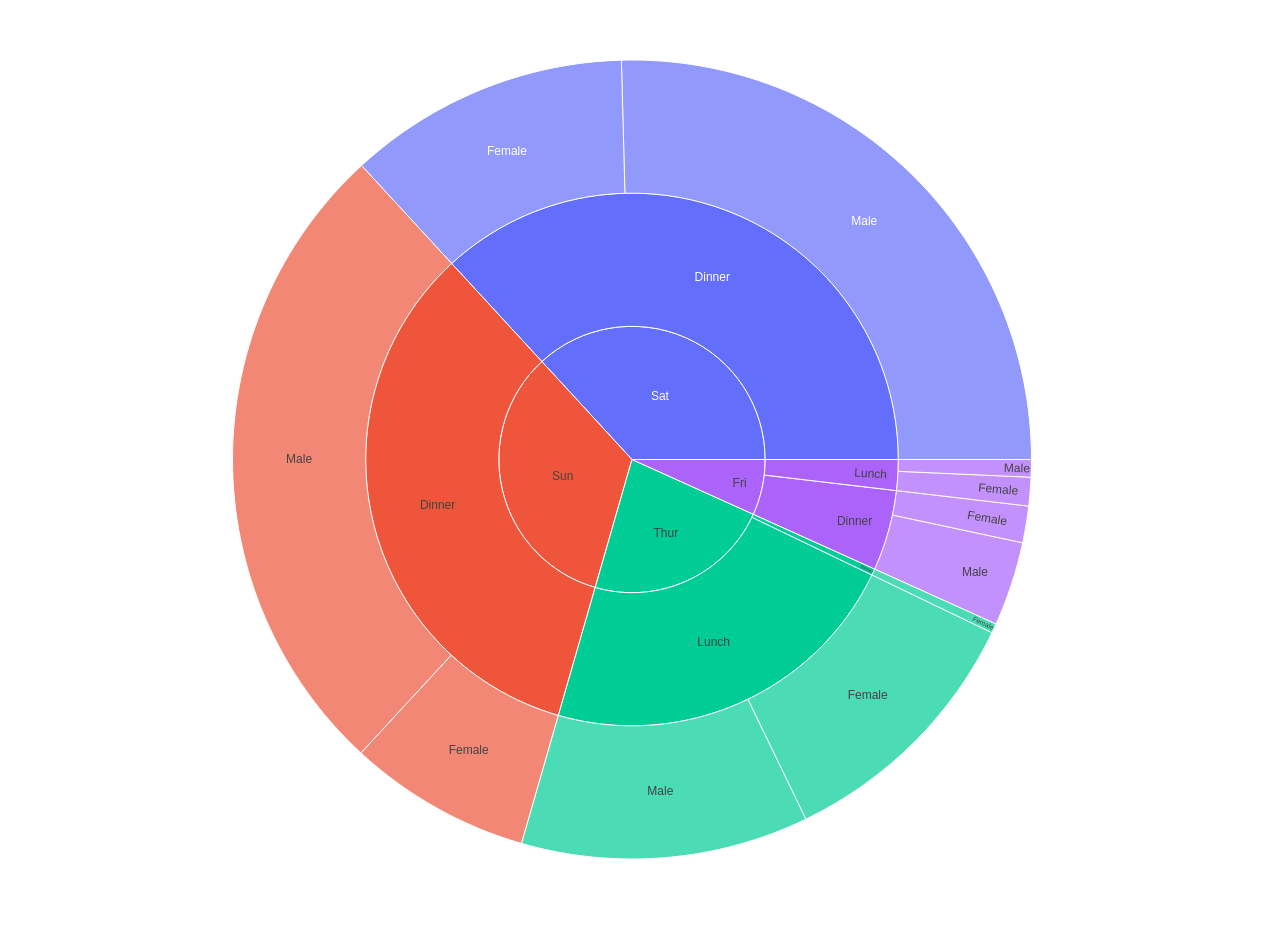
旭日图 常用于层级关系
1 2 3 4 5 6 7 8 9 10 11 12 13 14 15 16 17 18 df = px.data.tips() print (df)''' total_bill tip sex smoker day time size 0 16.99 1.01 Female No Sun Dinner 2 1 10.34 1.66 Male No Sun Dinner 3 2 21.01 3.50 Male No Sun Dinner 3 3 23.68 3.31 Male No Sun Dinner 2 4 24.59 3.61 Female No Sun Dinner 4 .. ... ... ... ... ... ... ... 239 29.03 5.92 Male No Sat Dinner 3 240 27.18 2.00 Female Yes Sat Dinner 2 241 22.67 2.00 Male Yes Sat Dinner 2 242 17.82 1.75 Male No Sat Dinner 2 243 18.78 3.00 Female No Thur Dinner 2 [244 rows x 7 columns] '''
绘图;
1 2 3 4 5 6 fig = px.sunburst( df, path=['day' , 'time' , 'sex' ], values='total_bill' ) fig.show()
图如下:
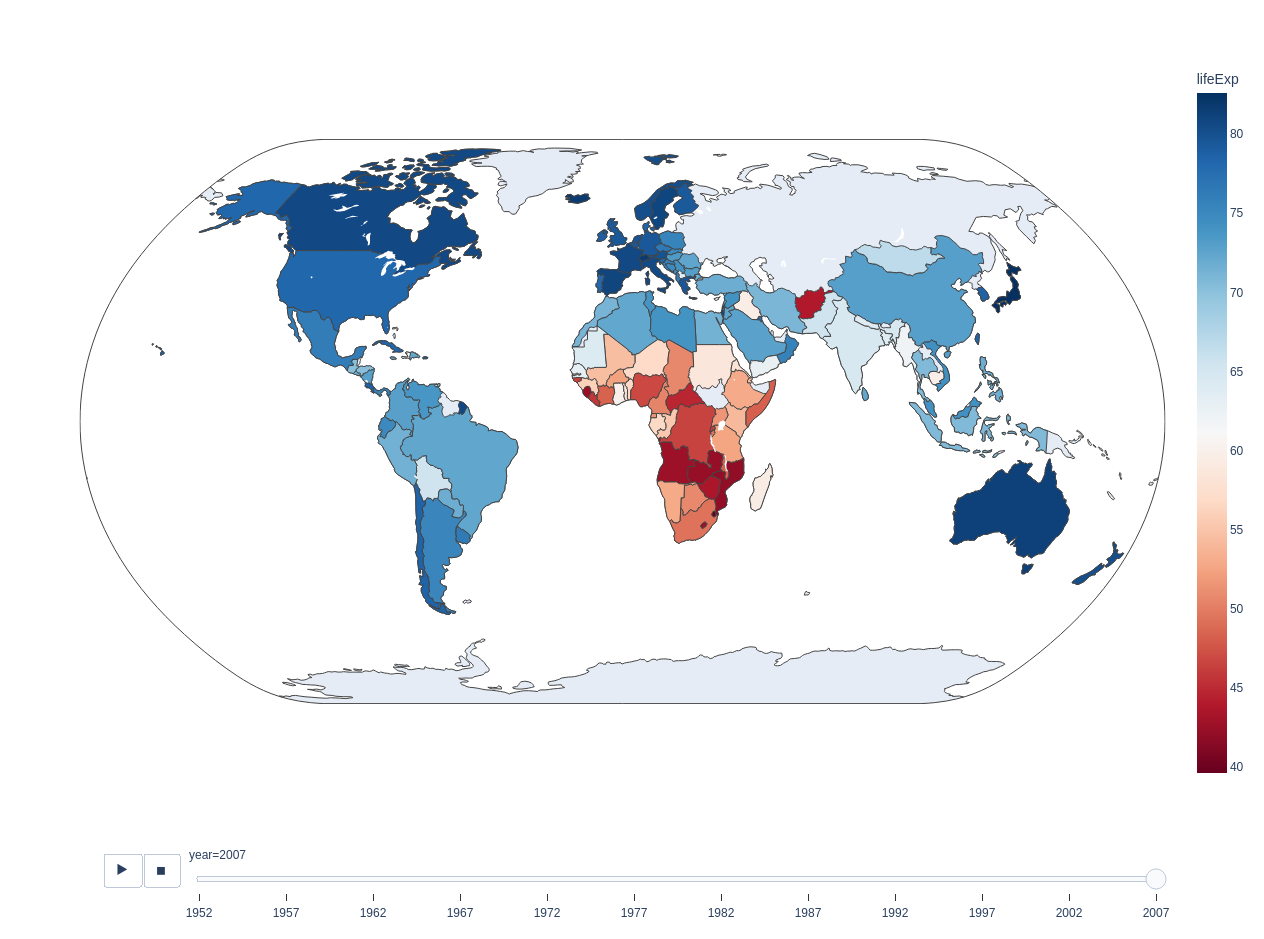
动态地图 源数据:
1 gapminder = px.data.gapminder()
绘图:
1 2 3 4 5 6 7 8 9 fig = px.choropleth( gapminder, locations='iso_alpha' , color='lifeExp' , animation_frame='year' , color_continuous_scale=px.colors.diverging.RdBu, projection='natural earth' ) fig.show()
图如下:
双Y轴 